 Research Article
Literature Review on Hybrid Photovoltaic – Diesel Power System in Sudan
Osama Mohammed Elmardi Suleiman Khayal*
Associate Professor, Nile Valley University, Faculty of Engineering and Technology, Department of Mechanical Engineering, Sudan
Osama Mohammed Elmardi Suleiman Khayal, Associate Professor, Nile Valley University, Faculty of Engineering and Technology, Department of Mechanical Engineering, Sudan.
Received Date: January 01, 2023; Published Date:January 23, 2023
Abstract
The present review paper presents a brief outline literature review on hybrid photovoltaic – diesel power system in Sudan.
The study is considered from several points of view, which include:
• Introduction to the industry of electricity in the Sudan; which includes general introduction, renewable energy characteristic and potential in
Sudan
• Solar energy systems that discusses solar radiation, solar irradiance and irradiation, solar spectrum, solar radiation atmospheric effect, air
mass, peak sun hours, photovoltaic systems, types of solar photovoltaic cells, photovoltaic system types.
• Modeling of hybrid renewable energy system that involves introduction, modeling of hybrid PV/Wind/Battery/Diesel.
• System reliability model.
• Energy cost model.
Keywords:Renewable energy; Electricity generation; Solar energy; Modelling of hybrid systems; Reliability model; Cost model
Introduction to the Industry of Electricity in the Sudan
General introduction
Sudan began the electricity industry in 1908; the first 100 KW generator was installed by an English Electric Company and then raised to 500 kW at Burri Power Plant in Khartoum. Due to the demand growth, in 1925 contract signed with group of British companies for a period of thirty years for the development of electricity [1] and [3].
Steam generation was started in 1956 at Burri Power station (30 megawatts) 4 steam turbines. In 1960, the government Established Central Electricity and Water Corporation, which began to extend electricity and water, services in major cities in the country.
Gas turbines generation began in 1968 at Kilo X Power station (15 MW) Fiat gas turbine. In 1982, Water Corporation was separated from Electricity Corporation. So that each can develop separately and render service independently.
The National Electricity Corporation (NEC) Act was passed also in 1982 to assign NEC to look after the National Grid, at the same time the state governments were assigned to take control of the regional power generating plants.
It is worth to mention that Khartoum North Power Station Phase I, comprised of 2 machines each one is 30 MW capacity was built in 1981 as a gift from British Government, the formal starting was in Dec. 1985 honored HRH Princess Anne [4].
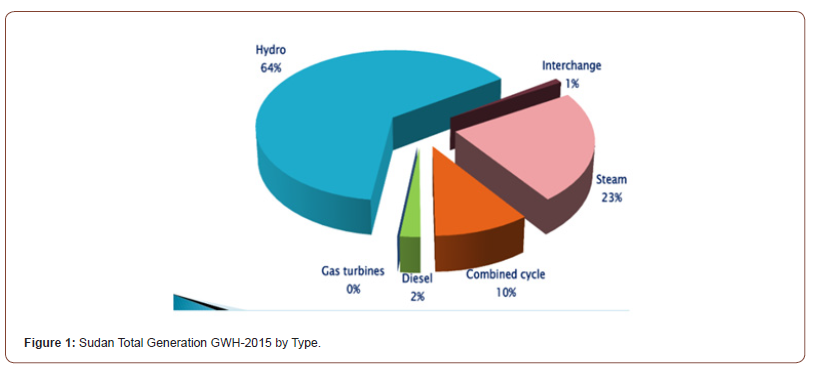
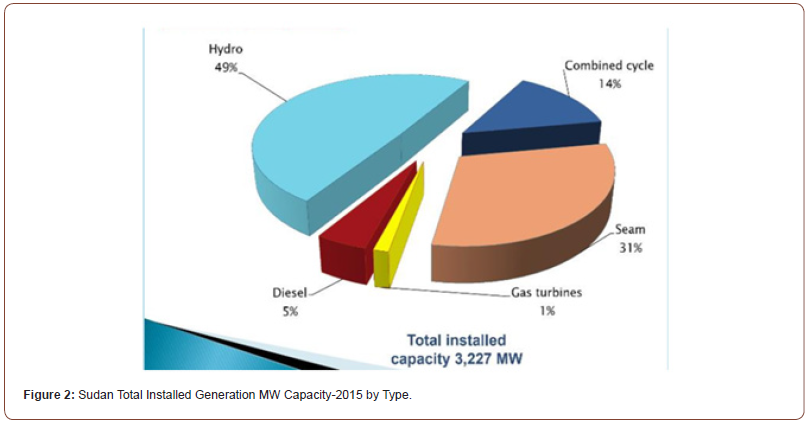
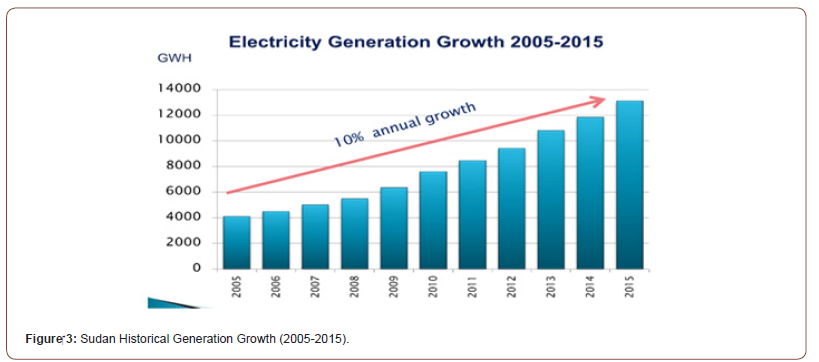
In 2015, the Electricity sector in Sudan acting under the umbrella of the Ministry of Water Resources, Irrigation and Electricity. The Electricity Sector now currently has an installed generation capacity of 3,227 MW of power, has no wind generation capacity and no grid-connected solar capacity as shown in Figures 1, 2 and 3. Approximately 35% of Sudan’s population has access to electricity; the power consumption per capita was 335 kWh/ year [1].
As part of the current energy policy, it is the aim of the
Government of Sudan to:
1. Increase the overall national electrification ratio to at least
from 35% now to 80% by 2031.
2. Connect all states of Sudan to the national grid by 2031 - as far
as practicable.
3. Utilize a high share of renewable energy sources considering
economic and technical limitations.
Sudan is in the midst of an energy transition. After losing, its oilrich South the country is now seeking for alternatives. Alternatives that can secure its energy needs and yet meet Sudan’s action plan in combatting climate change. There are many types of renewable, which provide clean environmental-friendly energies. These range from biomass (bioenergy), hydropower, solar, wind energies and more other. Renewable energy is a promising option for electricity generation, especially the wind and PV energy systems as they are clean energy sources and became mature technology. In addition, the wind energy source is considered as the world’s fastest growing energy source [5] and the PV energy source is the most easily scalable type of renewable energy generation.
Renewable energy characteristic and potential in Sudan
Sudan holds abundant renewable energy sources (RES). Its hydro resources are already being utilized or are under development. Besides the hydro resources, there is further RES potential through solar and wind energy, biomass and biogas, and geothermal energy [6].
Solar energy - Photovoltaic (PV) characteristic and potential: Solar photovoltaic (PV) power plants transform based on a range of semiconductor technologies, solar irradiation into electricity. The direct current produced by the solar power plant modules can run electric appliances or can be fed into the regular power system after being inverted into alternating current. The advantages of PV are the relatively simple and modular technology with low operation and maintenance costs. Its disadvantages are: (i) the relatively high investment costs, though they considerably decreased during the past years and a further significant decrease of investment costs is expected in future probably enlarging the potential of PV, and (ii) the intermittent characteristics of the underlying solar resource.
Sudan provides an excellent base for solar photovoltaic power development. Its favorable geographic position provides comparatively high global horizontal irradiation of 1900 to 2500 kWh/m2/year (which is roughly twice the typical value for central Europe) throughout the country as seen in Figure 2.4.
PV will be applicable for the entire country for on- and off-grid solutions. In order to approach the existing network close to the major load center, PV-arrays can be arranged around Khartoum 220/ 110 kV - network ring allowing easy network access and smooth integration for electric power production. This has the potential to provide power where and when it is needed and to replace fossil fuel-based generation. In addition, PV-array distribution in smaller cities and villages will be the leading renewable approach for fast and smooth electricity production upgrade in rural areas, it has the potential to either replace more costly fossil fuel-based generation or provide power to previously unsupplied areas.
Solar energy - Concentrating solar power (CSP) characteristic and potential: Concentrating solar power (CSP), plants transform direct solar irradiance (DNI) into heat, which in turn is transformed into electricity by means of a standard steam turbine and generator.
Hence, the CSP plant can directly feed into the regular power system. The advantages of CSP, in comparison to PV, is its potential to store and regulate the power output. Its disadvantages are the relatively high investment costs (compared to PV and wind) for the rather sophisticated technology, which causes also higher operation, and maintenance costs. Further CSP needs considerable amounts of water (depending on the cooling technology). It is restricted to areas with high direct solar irradiance (compared to direct and indirect solar irradiance for PV) and is influenced by the intermittent characteristics of the underlying solar resource (depending on the storage capacity and power system needs).
The potential resources are similar to PV the solar resource for CSP, the direct horizontal irradiance (DNI), in Sudan is relatively high due to its favorable geographic position. However, the DNI resource can be assumed to have a very high uncertainty due to the lack of ground measurement data for the verification of the satellite data. Good sites such as “Wadi Halfa” offer good resources required to develop a financially viable project: indicating DNI values significantly above 2,000 kWh/m2/year, water availability and network access.
Wind energy characteristic and potential: Wind turbines convert wind energy into electric energy, which can be directly fed into the regular power system. The advantages of wind power plants are the relatively low generation costs based on a mature technology. Its disadvantages are the relatively high effort (compared to for instance PV) for operation and maintenance, its restriction to areas with suitable wind energy (potentially far away from load centers) and the intermittent characteristics of the underlying wind resource. Wind power in Sudan is particularly feasible in strong wind regime areas (e.g. wind speeds of more than 7 m/s), for instance in areas near Dongola and Nyala and in some areas at the Red Sea coast (e.g. Tokar). It is expected that additional areas with sufficient potential for wind park planning can be found in the North State along the Nile valley [6].
Waste to energy characteristic and potential: Waste to energy plants incinerate waste to produce heat and electricity via a steam turbine and generator. While this provides the advantage, of firm capacity and energy with high capacity, factors (compared to other RES) the investment and thus generation costs can be high.
There is some potential for Waste to energy plants in Sudan. Specific waste quantities produced in Sudanese cities amount to 150 to 200 kg per inhabitant per year. Waste quantities available in seven cities in the country including Khartoum are deemed sufficient to supply and technically and economically justify the installation of waste to energy WtE plants. Total installed electrical capacities would amount to 68.2 MW including a waste incineration project of 50 MW (electric) in Khartoum. The other six cities suitable for smaller capacities to be installed include Nyala, Port Sudan, Elobayed, Kosti and Rabak, Wad Medani and Kassala. A steady and reliable provision of waste in terms of quantities and quality for incineration of the essence to sustain technical and economic feasibility of the plants.
Biomass and biogas characteristic and potential: The usage of biomass resources in Sudan for grid connected electricity production have been separated in the two energy conversion paths direct combustion and anaerobic digestion.
Power plants (or combined heat and power (CHP) plants, if the produced heat is also used) based on direct combustion use solid biomass as fuel that is directly burned on a grate to generate electricity via a conversion process with a water-steam-cycle including steam turbine and generator. Power (or CHP) plants based on biogas generate electricity via a conversion process where biogas is produced by anaerobic digestion (fermentation) of biomass that is used as fuel for internal combustion engines with generator. Both technologies provide the advantage of firm capacity and energy with high capacity factors (compared to other RES) – depending partly on agricultural seasons.
Potentially available residues in Sudan for direct combustion are basically lignocellulose (woody) biomass like bagasse (by product from production of sugar from sugar cane), cotton stalks, cotton waste, and groundnut shells (livestock excrements were considered exclusively for anaerobic digestion) but due to technoeconomic constraints only direct combustion of bagasse was taken into consideration for electricity generation. Bagasse is already used as fuel for the combined heat and power (CHP) plants at all sugar factories in Sudan. The sugar factories are owned by Sudanese Sugar Company (SSC) and Kenana Sugar (KSC) and are located in New Halfa, Assalaya, Guneid and Sinnar (all SSC) and Kenana (KSC).
The potentially available residues for anaerobic digestion in Sudan are livestock manure, byproducts and waste from dairies, wastewater from slaughterhouses as well as sewage (or sewage sludge), and molasses and Vinasse of sugar cane, but most residues are limited.
The locations of existing and potential direct combustion and biogas power CHP plants are mainly outside the greater Khartoum area, close to the industrial scale biomass production in the irrigation schemes.
It is recommended to retrofit or replace the existing combined heat and power plants of the five sugar factories by plants that are more efficient with higher power capacity. Co-combustion of bagasse with other biomass residues should be evaluated. Direct combustion of bagasse is expected to be the largest potential for biomass-based power generation in Sudan. The potential could be around additional 50 MW (electric, rough estimate) but the evaluation of the current situation of the existing CHP plants at the five sugar factories in Sudan from SSC and KSC is still in progress.
The sugar cane Vinasse of the ethanol plants at the sugar factories in Assalaya, which is owned by SSC; receives molasses from SSC sugar factories in Guneid, Sinnar and Kenana. The sugar cane molasses in New Halfa sugar factory (owned by SSC) are promising feedstock if the owners will confirm the assumed quantities and concentrations. The quantities of Vinasse and molasses should be huge enough to allow for a biogas plant. Biogas plants based on feedstock Vinasse or molasses could generate around 19.2 MW at the sites of the three sugar factories. In the greater Khartoum area as a first step, two biogas plants could be envisaged treating the organic residues. Although the electrical capacities of the plants will be relatively small (300 and 80 kW), the combined advantage of power generation, hygienic aspects and fertilizer production could make these biogas plants attractive.
Geothermal energy characteristic and potential: For the use of geothermal energy, the heat within the Earth’s mantle is pumped up to the surface and transformed into electricity by means of a steam turbine and generator. While this provides the advantage, of firm capacity and energy with high capacity, factors (compared to other RES) the development and thus generation costs can be high.
The analysis of the resource potential in Sudan is still on going and first results of geothermal potential in Bayuda area are yet available indicating temperatures of approximately 200 degree Celsius. However, further study analysis is required to come up with a reservoir model in order to provide capacity estimations.
The detailed geothermal study part continues for diverse areas in Sudan and results are not finalized. Geothermal resources appear so far not relevant for a strong impact on the overall electricity production for Sudan.
Small hydro power plants characteristic and potential: Advantages are the comparatively low generation costs if installed at existing facilities (e.g. dams, irrigation schemes) since the energy will be a by-product of their main purpose (mainly irrigation). The main disadvantages are the seasonal fluctuation of the energy generation and the limited possibilities to regulate the energy production according to the demand. Resource potential are estimated to be in a range of few 100 kW up to few MW but the overall potential in the country may sum up to 50 - 100 MW [6].
Solar Energy Systems
Solar radiation
The sun is the central star of the solar system in which the Earth is. It has a form of a large glowing ball of gas, the chemical composition of mostly hydrogen and helium, but also other elements that are in it to a lesser extent, like oxygen, carbon, iron, neon, nitrogen, silicon, magnesium and sulfur.
Energy from the Sun comes to the Earth in the form of solar radiation. Nuclear reactions take place in the interior of the Sun, during which hydrogen is transformed into helium by a fusion process, accompanied by the release of large amounts of energy, where the temperature reaches 15 million °C. Part of this energy comes to Earth in form of heat and light, and allows all processes, from photosynthesis to the production of electricity in photovoltaic systems.
Under optimal conditions, the earth’s surface can obtain 1.000 W/m2, while the actual value depends on the location, i.e. latitude; climatological location parameters such as frequency of cloud cover and haze, air pressure, etc.
Considering the sunlight and the productivity of photovoltaic
systems, it is necessary to understand the following concepts:
• Irradiation, average density of the radiant solar radiation
power, which is equal to the ratio of the solar radiation power
and surface.
• The plane perpendicular to the direction of this radiation (W/
m2).
• Radiation, which represents the quantity of solar radiation
that is radiated on the unit surface at a given time (Wh/m2)
or (J/m2). Besides expressing it in hourly values, it is often
expressed as daily, monthly or yearly radiation, depending on
the time interval.
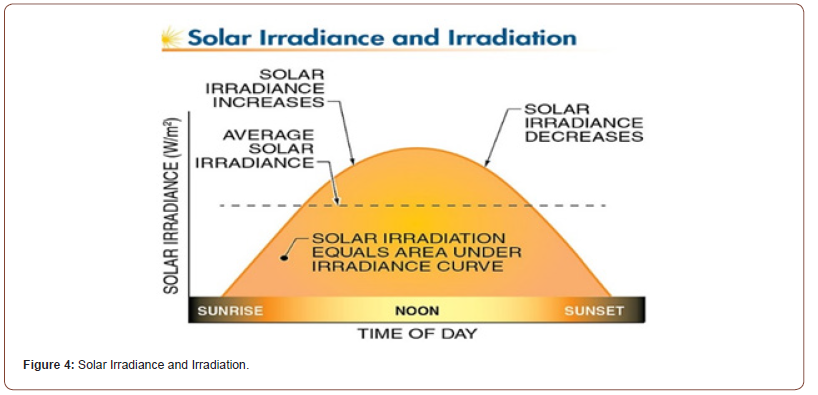
Solar irradiance and irradiation
Solar spectrum
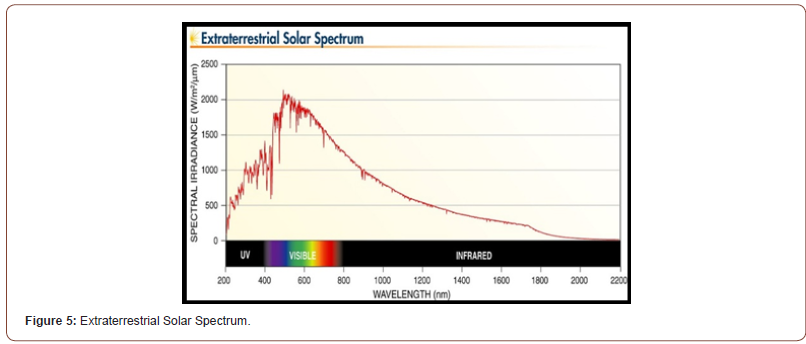
Figure 5 shows Extraterrestrial Solar Spectrum [7]. Solar radiation includes more types of energy than just visible light. Most of the energy from the sun covers a continuous portion of the electromagnetic spectrum, from ultraviolet to infrared, though not evenly. The distribution of extraterrestrial solar power at various wavelengths forms a spectral signature unique to the sun. See Figure 5. A similar, though attenuated, spectrum of solar energy reaching Earth’s surface is studied to determine how atmospheric effects reduce the energy levels of certain wavelengths and affect PV device performance.
Solar radiation atmospheric effect
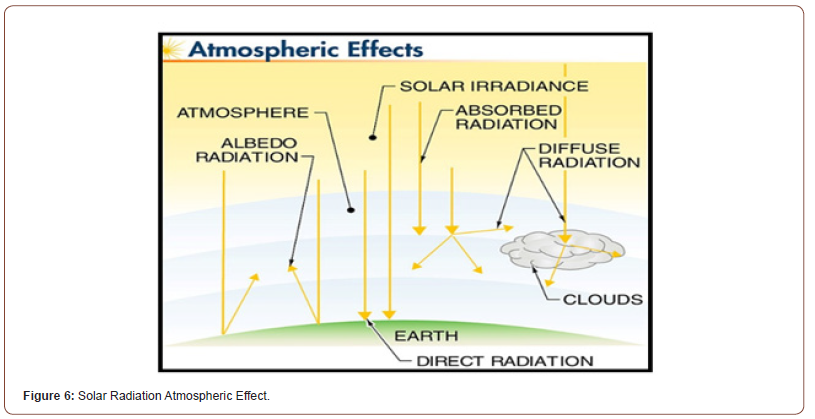
Figure 6 shows Solar Radiation Atmospheric Effect [7]. Solar radiation is absorbed, scattered, and reflected by components of the atmosphere, including ozone, carbon dioxide, and water vapor, as well as other gases and particles. Cloud cover and local conditions such as dust storms, air pollution, and volcanic eruptions can also greatly reduce the amount of radiation reaching some areas. The two major types of radiation reaching the ground are direct radiation and diffuse radiation. See Figure 6. Total global radiation is all of the solar radiation reaching Earth’s surface and is the sum of direct and diffuse radiation.
Air mass
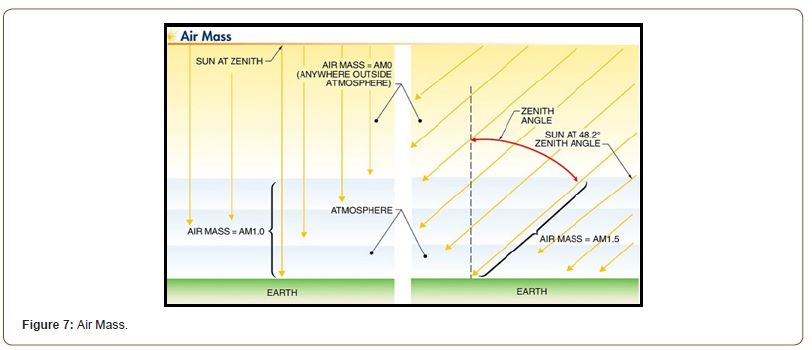
Figure 7 shows Air Mass. Air mass is a representation of the amount of atmosphere radiation that must pass through to reach Earth’s surface. The amount of solar radiation that is absorbed or scattered in the atmosphere depends on how much atmosphere it passes through before reaching Earth’s surface. When the sun is at zenith, the amount of atmosphere that the sun’s rays have to pass through to reach Earth’s surface is at a minimum. As in Figure 7. Zenith is the point in the sky directly overhead a particular location. The zenith angle is the angle between the sun and the zenith. As the zenith angle increases (the sun approaches the horizon), the sun’s rays must pass through a greater amount of atmosphere to reach Earth’s surface. This reduces the quantity of solar radiation, and also changes its wavelength composition.
Peak sun hours
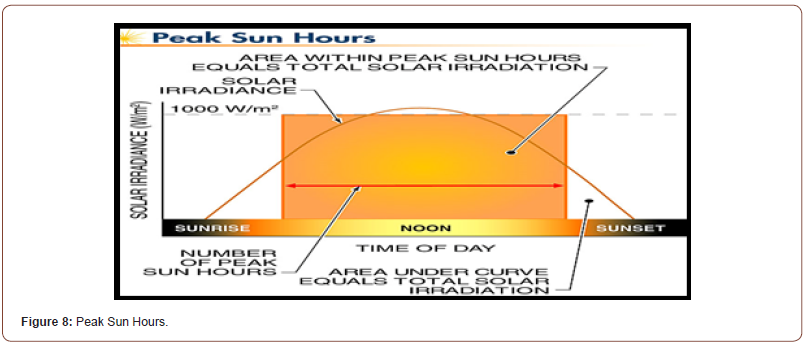
Figure 8 shows Peak Sun Hours. Peak sun hours are the number of hours required for a day’s total solar irradiation to accumulate at peak sun condition. An average day may have only one or two actual hours at peak sun condition, but the total irradiation for a day may be expressed in units of peak sun hours by dividing by 1000 W/ m2 (peak sun irradiance). A day with an average irradiance of 600 W/m2 over 8 hours may only reach peak sun condition for an hour or less around noon. However, the total irradiation of 4800 Wh/m2 (600 W/m2 × 8 hrs. = 4800 Wh/m2) is equivalent to 4.8 peak sun hours (4800 Wh/m2 / 1000 /m2 = 4.8 peak sun hr.).
Photovoltaic systems
Converting solar energy into electrical energy by PV installations is the most recognized way to use solar energy. Since solar photovoltaic cells are semiconductor devices, they have a lot in common with processing and production techniques of other semiconductor devices such as computers and memory chips. As it is well known, the requirements for purity and quality control of semiconductor devices are quite large. With today’s production, which reached a large scale, the whole industry production of solar cells has been developed and, due to low production cost, it is mostly located in the Far East. Photovoltaic cells produced by the majority of today’s most large producers are mainly made of crystalline silicon as semiconductor material.
Solar photovoltaic modules, which are a result of combination of photovoltaic cells to increase their power, are highly reliable, durable and low noise devices to produce electricity. The fuel for the photovoltaic cell is free. The sun is the only resource that is required for the operation of PV systems, and its energy is almost inexhaustible. Figure 9 shows Photovoltaic Cells [9].
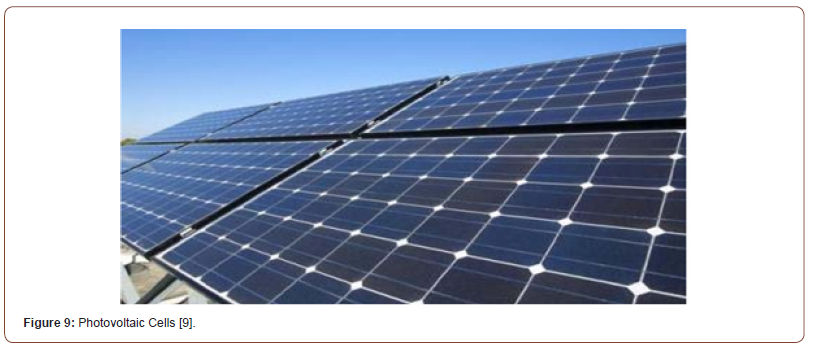
A typical photovoltaic cell efficiency is about 15%, which means it can convert 1/6 of solar energy into electricity. Photovoltaic systems produce no noise, there are no moving parts and they do not emit pollutants into the environment. Taking into account the energy consumed in the production of photovoltaic cells, they produce several tens of times less [8].
Types of solar photovoltaic cells
Electricity is produced in solar cells, which, as noted, consist of more layers of semi conductive material. When the sun’s rays shine down upon the solar cells, the electromotive force between these layers is being created, which causes the flow of electricity. The higher the solar radiation intensity the greater the flow of electricity.
The most common material for the production of solar cells is
silicon. Silicon is obtained from sand and is one of the most common
elements in the earth’s crust, so there is no limit to the availability
of raw materials.
Solar cell manufacturing technologies are:
• Monocrystalline;
• Polycrystalline;
• Bar‐crystalline silicon;
• Thin‐film technology.
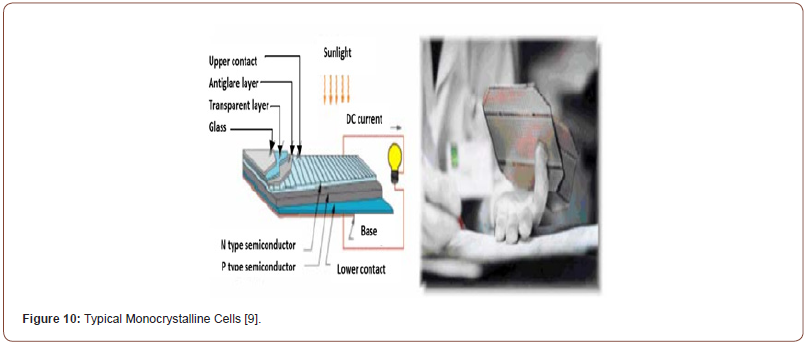
Cells made from crystal silicon (Si), are made of a thin sliced piece (wafer), a crystal of silicon (monocrystalline) or a whole block of silicon crystals (multi crystalline); their efficiency ranges between 12% and 19%.
Monocrystalline Si cells: Conversion efficiency for this type of cells ranges from 13% to 17%, and generally, it said to be in wide commercial use. Figure 10 below shows Typical Monocrystalline Cells [9].
Photovoltaic system types
Photovoltaic systems can be generally divided into two basic
groups:
• Photovoltaic systems not connected to the network, standalone
systems (off‐grid).
• Photovoltaic systems connected to public electricity network
(on‐grid).
There are lots of different subtypes of photovoltaic systems according to type and method of connecting to the network, or a way of storing energy on independent systems.
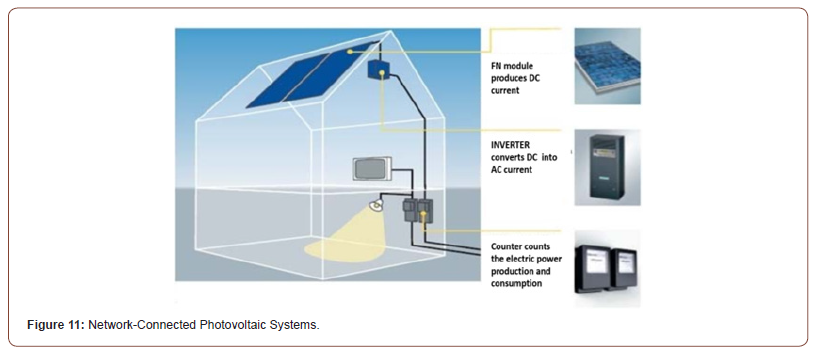
Network‐Connected photovoltaic systems (On‐Grid): The main components of PV systems are photovoltaic modules, photovoltaic inverter, mounting sub-frame and measuring cabinet with protective equipment and installation.
Photovoltaic modules convert solar energy into DC current, while photovoltaic inverter adjusts the produced energy in a form, which can be submitted to the public grid. The AC voltage is supplied to the electricity network through the protection and measuring equipment. Figure 11 below shows Network‐Connected Photovoltaic Systems.
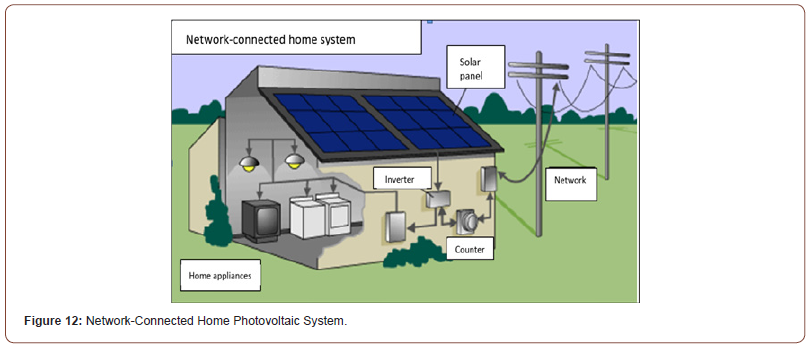
Network‐Connected home systems (Possibility for own consumption): These are the most popular types of solar photovoltaic systems that are suitable for home and commercial installations in developed and urban areas. Connection to the local electricity network allows selling to the local distributor of electric energy any excess of electricity generated and not used in the household consumption, because the PV system is connected to the network via a home installation in parallel operation with the distribution system. In addition, the home is supplied with electricity from the grid when there is no sunny weather. The inverter, as already discussed, is used to convert direct current (DC) produced by the photovoltaic modules into alternating current (AC) located in the electrical grid and used to drive all the household appliances as illustrated in Figure 12. Figure 12 shows Network‐ Connected Home Photovoltaic System [9].
Network‐Connected solar power plants (Farms): These systems, also connected to the network, are generating large amounts of electricity by a photovoltaic installation on a localized area. The power of such photovoltaic power ranges from several hundred kilowatts to tens of megawatts as shown in Figure 13, recently up to several hundred megawatts.
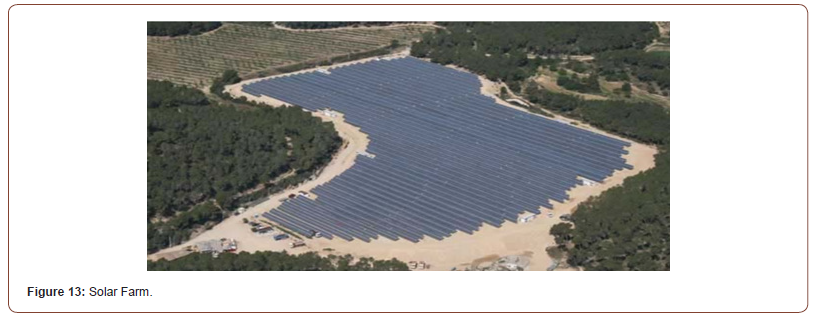
Some of these installations can be located on large industrial facilities and terminals, but more often on large barren land surfaces. Such large installations are exploiting existing facilities to produce electricity at the location and thus compensate part of the electric energy demand in the area. It is worth to mention an example of a large‐scale solar farm in the former military airport in Germany. This farm has the following specifications: 40 MW power, thin film technology, surface area 110 hectares (i.e. Equivalent to an area of 200 football stadiums), the expected annual production of 40 million kWh of electricity saves 25.000 tons of CO2, and costs about 130 million €. Figure 13 above shows this great solar farm [9].
Standalone systems (Off‐Grid) or Isolated systems: Figure 14 below shows Standalone Photovoltaic Systems [9].
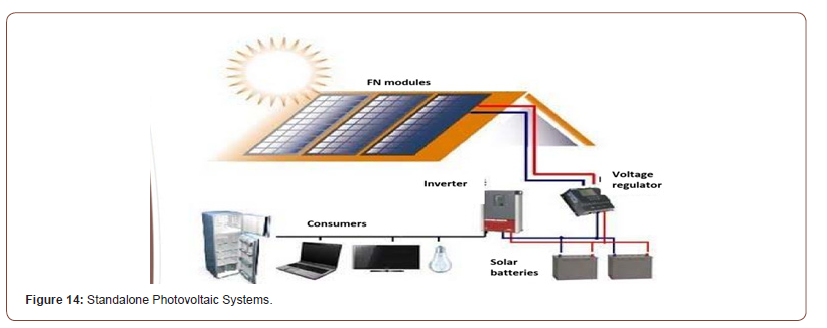
These systems are used in rural areas where there is no electricity network and/or any other energy infrastructure. The systems are connected to a reservoir of energy (i.e. battery) by control over the filling and emptying. The inverter can also be used to provide alternating current for standard electrical equipment and typical stand‐alone Photovoltaic installations are used to ensure the availability of electricity in remote areas (mountain resorts, islands, rural areas in the developing areas). Rural electrification means either small home solar photovoltaic installations covering basic electricity needs of an individual household, or bigger solar photovoltaic network that provides enough electricity for several households.
Hybrid systems: A solar photovoltaic system can be combined with other energy sources, such as biomass generator, wind turbines, diesel generator, all to ensure a constant and sufficient supply of electricity, since it is known that all renewable energy sources, including photovoltaic systems, are not constant in energy production. It means that, when there is no sun, the system does not produce electricity, although the need for energy is constant, and therefore must be met from other sources. The hybrid system can be connected to a network, stand‐ alone or as a support network [10].
Modeling of Hybrid Renewable Energy System
Introduction
Traditionally, to generate and meet the electricity demand, fossil fuels are used as the primary sources of energy. However, crisis in conventional fuel sources, upward trend of fuel prices, and harmful gas emission due to the burning of fossil fuels have challenged the future viability of the human civilization that is depending on conventional energy sources. In recent years, renewable energy technologies have drawn greater global attention due to their positive impact on addressing environmental concerns (CO2 emission that leads to global warming) and their capability to meet the growing energy demand. Moreover, low operation and maintenance costs, as well as their easy setup, have resulted in increased integration of renewable energy sources (RES) in recent years. As a clean source of energy with zero fuel, minimum cost, renewable energy has gained substantial technical developments, with more ongoing researches in academia and industry. Renewable power generating capacity saw its largest annual increase ever in 2016, with an estimated 161 gigawatts (GW) of capacity added. Total global capacity was up nearly 9% compared to 2015, to almost 2,017 GW at year’s end the world continued to add more renewable power capacity annually than it added (net) capacity from all.
Fossil fuels combined in 2016, renewables accounted for an estimated nearly 62% of net additions to global power generating capacity [8]. According to the historical data by International Energy Agency (IEA) [12], there is a clear sign of domination by renewable energy in electricity generation. However, present technical concerns of intermittent RES nature have somewhat limited RES penetration level in the existing power system. With a current share of less than 10% of the total electricity generation from RES, a great technical advancement is needed to integrate the nearly expected 100% share of RES by 2050. Due to geographical location, long distances from the main electric power grid, high cost of the power transmission lines, technical constraints in remote locations, and reliability concern of electric power supply because of the natural adversities, access to the electricity has become a foremost concern in rural regions. Renewable energy resources, mainly PV and wind, can be a good solution for rural electricity supply [10], and [11].
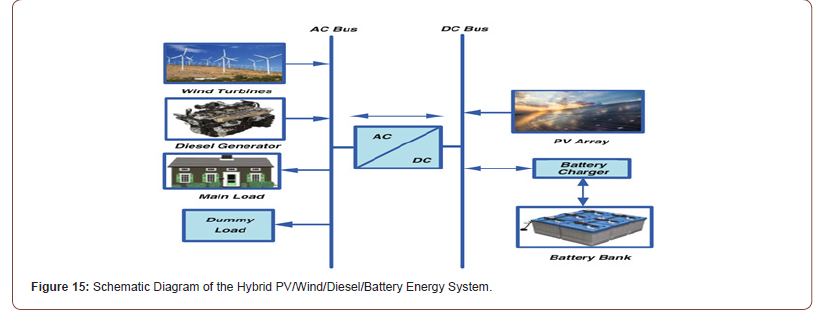
Figure 15 below shows Schematic Diagram of the Hybrid PV/ Wind/Diesel/Battery Energy System [11].
Renewable Energy Systems (RES) can be connected together in a DC-bus, or AC-bus, or in a hybrid DC/AC buses. The choice of the appropriate configuration depends on the type of output power for most generation and loads. Therefore, it is better to use DCbus coupling if most generation and some loads are DC [14] and to use AC-bus coupling in the case of mainly AC generation and loads [13]. If the major power sources of the Hybrid Renewable Energy Systems (HRES) generate a mixture of AC and DC power, then a hybrid-coupled integration scheme is preferable (i.e. hybrid DC/ AC-buses) [15], as shown in Figure 15.
Modeling of Hybrid PV/Wind/Battery/Diesel
The configuration used in Figure 1 consists of wind energy and Photovoltaic (PV) energy systems, Diesel Generator (DG), battery bank, charge controller, bidirectional converter, main load, and dummy load (a device used to simulate an electrical load, usually for testing purposes). The dispatch of this configuration is easy to be understood. The main load is supplied primarily from the WT and PV array through the bidirectional converter.
The excess power from the wind energy system and/or PV energy system above the load demand is stored in the battery bank until the batteries are completely charged. If the battery storage is full; excess power (i.e., dummy power) will be used to supply certain special loads (i.e., dummy loads), such as loads for cooling and heating purposes, water pumping, and charging the batteries of emergency lights. When the load power is greater than the generated power, the deficit power will be compensated from the batteries until they reach the minimum SOC (SOC min). When n the battery storage is exhausted and the HRES fails to meet the load demand, DG is used. Mathematical modeling of the proposed HRES parts is detailed in the following subsections:
Modeling of wind energy system: Wind resources and the electric power output from Wind Turbine (WT) at a particular location depend on wind speed at the hub height, the WT speed characteristics. Wind speed at the hub height of WT is calculated by the power law equation using the wind speed data collected at the anemometer height as [16]:

Where, u(h) and u(hg) are wind speeds at hub height (h) and anemometer height (hg), respectively, and α is the roughness factor. The value of α differs from site to site and from time to time at the same site.
The output power of WT is described in terms of wind speed from the typical power curve characteristics of the WT as follows [16]:

where, PW is the WT output power, Pr is the rated output power of WT, uc is the cut-in wind speed, ur is the rated wind speed, and uf is the cut-off wind speed.
The capacity factor of the WT can be calculated as follows:

Weibull distribution is a statistical tool that can be used to model wind speeds.
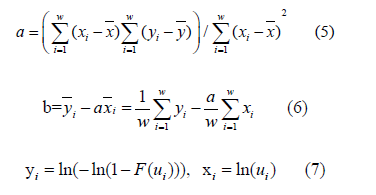
This tool can identify how often winds of different speeds will be seen at a particular location with a certain average wind speed. The Weibull parameters, shape parameter (k) and scale parameter (c) are calculated using the following statistical analysis method, respectively [17].

Where, x and y are the mean values of xi and yi, respectively.
The average power generated by each WT at a certain site can be calculated in terms of the Weibull parameters and the capacity factor from the following Equations:

Where, PWT, av is WT average power.
The number of WT (NWT) required to supply an average annual demand (PL, av) can be calculated by the following equation:

Modeling of PV energy system: The solar radiation on tilted surface (Ht) can be estimated considering the solar insolation, ambient temperature, and manufacturer’s data of the PV panels, slope of the PV panels and latitude and longitude of the site [18], and [19]. The output power of the PV system (PPV) is calculated as expressed in the following equation [20]:

Where, μc(t) is the hourly generating efficiency of the PV system and can be obtained in terms of the cell temperature as shown in the following equation [19]:

Where, βt is the temperature coefficient, ranging from 0.004 to 0.006 per °C for silicon cells [19]. μcr and Tcr are the theoretical solar cell efficiency and temperature at solar radiation flux of 1000 W/m2, respectively. μcr and βt are usually given by the PV module manufacturers. For the usual theoretical temperature Tcr = 25 °C, a literature average value for crystalline silicon modules theoretical efficiency is μcr = 0.12. Tc(t) is the hourly solar cell temperature at the ambient temperature (Ta), and can be obtained from the following equation [21]:

Where, λ is the Ross coefficient, expresses the temperatures rise above ambient with increasing solar flux. Earlier reported values for λ were in the range 0.02–0.04 Cm2/W [21]. PVA is the total solar cells area required to supply the load demand and can be calculated from the following equation:

Where, Fs is the safety factor which includes the possible allowance of insolation data inaccuracy, VF is the factor of variability which considers the impact of yearly radiation variation, and their values are around 1.1 and 0.95, respectively.
Battery Storage Model: The State of charge (SOC) after certain time (t) is calculated based on the energy balance between the wind, PV energy systems and the load as given by the following equations:

Where, EB is the energy of the battery bank, ηBC, ηBD are the charging, and discharging efficiency of the battery bank, ηBC and ηBD can be considered as 90% and 85%, respectively [22]. σ is the battery self-discharge rate; it is assumed as 0.2% per day for most batteries [23].
At any time, the battery bank should follow the following constraints:

Where, EB, max and EB, min are the maximum and minimum allowable storage capacities of the battery bank, respectively. EB, min can be obtained from the following equation:

Where, EBR is the nominal storage capacity of the battery bank, and DOD is the maximum depth of discharge of the battery bank.
Diesel generator model: DG is the conventional source of energy, which is used as a backup to supply the power deficiency in HRES. The hourly fuel consumption of DG is assessed using the following equation [24]:

where, Df(t) is the hourly fuel consumption of DG in L/h, PDg is the average power per hour of the DG, kW, PDgr is the DG rated power, kW, αD and βD are the coefficients of the fuel consumption curve, L/kWh, these coefficients have been can be considered to be as 0.246 and 0.08145, respectively [25].
System reliability model
The reliability of the HRES is developed based on the concept of Loss of Load Probability (LOLP), which is considered as the technical implemented criteria for sizing HRES and can be defined as [26]:

Energy cost model
Leveled Energy Cost (LEC) is a standout amongst the most known and utilized indicator of economic analysis of HRES and it can be calculated using the following equation [27]:

Where, TPV is the total present cost of the entire system, LAE is the annual load demand, and CRF is the capital recovery factor. CRF and TPV are expressed as:

Where, r is the net interest rate and T is the system lifetime in years (the system lifetime normally taken as 25 years. IC is the initial capital cost of the HRES components, including the civil work, installation cost, and electrical connections and testing. The civil work and installation costs can be considered approximately to be taken as 40% of PV generator price for the PV part and 20% of wind generator price for the wind part [27]. IC can be determined from the following equation:

Where: PVP is the PV price per kW ($/kW); CPV is the rated power of the PV system (kW); WTP is the WT price per kW ($/kW); EBR is the battery capacity (kWh); BP is the battery bank price per kWh ($/kWh); INVP is the converter price per kW ($/kW); DGP is the DG price per kW ($/kW);
OMC is the present value of operation and maintenance cost of the HRES segments all over the lifetime of the system. OMC include such items as an operator’s salary, inspections, insurance and all scheduled maintenance. OMC can be determined using the following equations [27]:

Where: OMCO is the operation and maintenance cost at the first year of the project lifetime.
Conclusion
Sudan is an agricultural country with fertile land, plenty of water resources, livestock, forestry resources, and agricultural residues. Energy is one of the key factors for the development of national economies in Sudan and Electric power is a key driver of economic growth and prosperity.
In Sudan although the utility of electricity generation and distribution was working hard to supply electric power to rural and remote areas, but still accessing electricity service remains dream for the majority of the population living in remote and arid rural areas.
According to confidential sources in the Federal Ministry of Water Resources and Electricity [1]. There are six large isolated grids in Sudan, named after the towns, they are serving: Nyala, Eldaein, Elfashir and Elgeneina in Darfur states, Kadogli and Elnuhood in Kordofan. In total, these isolated grids make up about 2% of the grid connected energy consumption and 3% of all gridconnected customers; their cumulative peak load is about 4% of the annual peak load of the national grid.
Recently the electricity sector authority in Sudan adopted the combination of PV with diesel to offer a distinct environmental and economic benefits compared with a diesel generator on its own. Each energy source is used to best advantage, taking account of its special features. Substantial savings on diesel fuel and maintenance can be realized in those hybrid systems where a diesel generator remains the most realistic option for meeting occasional high load demands and providing security of supply.
The motivation that led to the writing of the present review paper is the necessity to exploit the high potentiality of solar energy in Sudan. Therefore, a suitable energy converter is needed to utilize this abundant energy.
Acknowledgement
None.
Conflicts of Interest
No conflict of interest.
References
- Ministry of Water Resources and Electricity (Long and Medium Term Power System Plans 2012-2031).
- Master Thesis (2016) Design of a PV-Diesel Hybrid System with Unreliable Grid Connection in Lebanon. European Solar Engineering School, No. 217.
- (2015) Report The Industry of Electricity in the Sudan, 2015 Ministry of Water Resources, Irrigation and
- Phuangpornpitak N, Tia S (2011) Feasibility study of wind farms under the Thai very small-scale renewable energy power producer (VSPP) program. Energy Procedia 9: 159-170.
- Ministry of Water Resources (2012) Irrigation and Electricity, Long and Medium Term Power System Plans Sudan (2012-2031).
- James P Dunlop (2012) Photovoltaic Systems (Third Edition). American Technical Publishers, Incorporated.
- Renewables (2017) Global Status Report, Paris, 2017.
- (2012) Photovoltaic Systems.
- SC Bhatia, RK Gupta (2018) Hybrid systems. In S. C. Bhatia, R. K. Gupta (First Edition). Textbook of Renewable Energy, New Delhi, India: Wood head publishing, pp. 66.
- Mohamed Abdul-Aziz Mohamed, Ali Mohamed Eltamaly (2018) Modeling of Hybrid Renewable Energy System. In Janusz Kacprzyk (Volume 121). Modeling and Simulation of Smart.
- (2018) Grid Integrated with Hybrid Renewable Energy Systems. Cham, Switzerland: Springer International Publishing AG, pp. 31-37.
- IEA (2016) Renewables Information-Key Renewables Trends.
- Nottona G, Diaf S, Stoyanov L (2011) Hybrid photovoltaic/wind energy systems for remote locations. Energy Proc 6: 666–677.
- Ferrer-Martía L, Garwood A, Chiroque J, Ramirez B, Marcelo O, et al. (2012) Evaluating and comparing three community small-scale wind electrification projects. Renewable Sustain. Energy Rev 16(7): 5379-5390.
- Setiawan AA, Zhao Y, Nayar CV (2009) Design, economic analysis and environmental considerations of mini-grid hybrid power system with reverse osmosis desalination plant for remote areas. Renewable Energy 34(2): 374-383.
- Wang C, Nehrir MH (2008) Power management of a stand-alone wind/photovoltaic/fuel cell energy system. IEEE Transactions on Energy Conversion 23(3): 957-967.
- Eltamaly AM, Mohamed MA (2014) A novel design and optimization software for autonomous PV/wind/battery hybrid power systems. Mathematical Problems in Engineering 637174: 1-16.
- Kohsri S, Plangklang B (2011) Energy management and control system for smart renewable energy remote power generation. Energy Procedia 9: 198-206.
- Sreeraj ES, Chatterjee K, Bandyopadhyay S (2010) Design of isolated renewable hybrid power systems. Solar Energy 84(7): 1124-1136.
- Lun IY, Lam JC (2000) A study of Weibull parameters using long-term wind observations. Renewable Energy 20(2): 145-153.
- Mohamed MA, Eltamaly AM, Alolah AI (2015) Sizing and techno-economic analysis of stand-alone hybrid photovoltaic/wind/diesel/battery power generation systems.
- Eltamaly AM, Mohamed MA (2016) A novel software for design and optimization of hybrid power systems. Journal of the Brazilian Society of Mechanical Sciences and Engineering 38(4): 1299-1315
- Habib MA, Said SAM, El-Hadidy MA, Al-Zaharna I (1999) Optimization procedure of a hybrid photovoltaic wind energy system. Energy 24(11): 919–929.
- Skoplaki E, Boudouvis AG, Palyvos JA (2008) A simple correlation for the operating temperature of photovoltaic modules of arbitrary mounting. Solar Energy Materials and Solar Cells 92(11): 1393–1402.
- Mohamed MA, Eltamaly AM, Alolah AI (2017) Swarm intelligence-based optimization of grid-dependent hybrid renewable energy systems. Renewable and Sustainable Energy Reviews 77: 515–524.
- Yang H, Zhou W, Lu L, Fang Z (2008) Optimal sizing method for stand-alone hybrid solar-wind system with LPSP technology by using genetic algorithm. Solar Energy 82(4): 354–367.
- Ismail MS, Moghavvemi M, Mahlia TMI (2013) Techno-economic analysis of an optimized photovoltaic and diesel generator hybrid power system for remote houses in a tropical climate. Energy Conversion and Management 69: 163–173.
-
Osama Mohammed Elmardi Suleiman Khayal*. Literature Review on Hybrid Photovoltaic – Diesel Power System in Sudan. Glob J Eng Sci. 10(5): 2023. GJES.MS.ID.000748.
-
Renewable energy, Electricity generation, Solar energy, Modelling of hybrid systems, Reliability model, Cost model
-

This work is licensed under a Creative Commons Attribution-NonCommercial 4.0 International License.


